判別分析
MASS パッケージにより、線形判別分析、二次判別分析を行うことができる。事前確率が未知の場合でも、サンプルサイズから仮定して実行できる。
線形判別分析
					# 例によって足立浩平 (2006). 多変量データ解析法――心理・教育・社会系のための入門―― ナカニシヤ出版 第15章 p145 から。感謝


					# p150 表15.1 線形判別分析のデータと結果

					grp <- factor(c(rep("a", 15), rep("b", 12)))

					sha <- c(15,11,16,19,18,15,17,12,13,14,16,11,20,15,13, 11,10,11,10,10,13,11,15,12,10,12,10)

					kyo <- c(14,13,14,21,26,28,19,15,22,26,20,15,21,20,13, 15,13,14,10,14,19,10,20,22,11,10,14)

					kin <- c(15,17,17,18,21,18,12,18,16,18,18,20,17,19,17, 18,16,24,13,22,23,20,20,23,18,19,21)

					shi <- c(14,17,26,15,15,12,10,12,10, 6,18,15,20,12,16, 17, 9,16,12,18,24,28,16,13,10,27,19)

					dat <- data.frame(grp, sha, kyo, kin, shi)


					library(MASS)

					fit <- lda(grp ~ sha+kyo+kin+shi, data=dat)

					fit


					# 判別精度

					cprp(table(dat$grp, predict(fit)$class))$rp


					# 判別関数

					fit$scaling

					# 切片

					 apply(fit$means %*% fit$scaling, 2, mean)


					# 判別得点と判別結果 (表15.1 (B))

					data.frame(predict(fit)$x, predict(fit)$class, dat$grp)


					# 事後確率 (個々のサンプルがどちらのケースに属するか)

					predict(fit)$posterior
CV=Tとすることで交差検証 (cross validation) を行える。lda関数の交差検証はleave one out式 (ジャックナイフ推定) なのでspssとは結果が異なる。
					# 交差検証

					 # 簡便な評価法

					 table(dat$grp, predict(fit)$class)


					 # 交差検証法

					 cvfit <- lda(grp~., data=dat, CV=T)

					 (ct <- table(grp, cvfit$class))

					 ct

					 diag(prop.table(ct, 1))

					 sum(diag(prop.table(ct))) # 全体の正判別率
lda() 関数の返す判別関数は変数を中心化したもので標準化したものではない。ゆえに、proportion of trace は級間分散の説明率である。有意性検定は実行されない。それについては多変量分散分析 を参照。
二次の判別分析
二次の判別関数を得るにはqda( ) 関数を使う。これは分散共分散行列の等質性を仮定しない。
# Quadratic Discriminant Analysis with 3 groups applying

					#
				resubstitution prediction and equal prior probabilities.

				library(MASS)

				fit <- qda(G ~ x1 + x2 + x3 + x4, data=na.omit(mydata),

				  prior=c(1,1,1)/3))
注意 欠損値のリストワイズ除去指定のほかのやり方:CV=Tとしない場合代替推定法 (re-substitution. モデル推定に使ったデータをまた使って精度の推定を行う) がデフォルトで使われる。精度が高いのが当たり前の楽観的手法。
結果の視覚化
作図例。ポイントは群の名前。
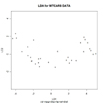
# 判別関数の散布図

					fit <- lda(cyl~mpg+disp+hp+wt+drat, data=mtcars)

					plot(fit)
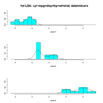
第1判別関数次元にもとづく各群のヒストグラムと密度関数。
plot(fit, dimen=1, type="both")
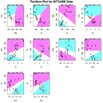
klaR パッケージのpartimat( ) 関数は2変数以上の線形・二次判別の結果を一度に表示できる。
				library(klaR)

				partimat(factor(cyl)~mpg+disp+hp+wt+drat, data=mtcars, method="lda")
群ごとの散布図
pairs(mtcars[c("mpg","disp","hp", "wt", "drat")], main="Scatterplot Matrix for MTCARS Data", pch=22, bg=c("red", "yellow", "blue")[unclass(factor(mtcars$cyl))])
仮定の検証
多変量正規分布と共分散行列の等質性仮定をおいている。(多変量) 分散分析の仮定 参照。


